
.jpg)











The reforms have raised the operating hurdle for landlords. But the early evidence points to a more complicated market than either collapse or business as usual.
Just over 100 days have passed since England’s private rented sector underwent its biggest regulatory change in decades.
Section 21 disappeared. Existing assured shorthold tenancies moved onto the new assured periodic tenancy regime. Rent increases became more prescribed, rental bidding was prohibited and landlords became more reliant on defined possession grounds.
The predictions were hardly optimistic. Recent analysis by The Telegraph analysis argued that Labour had managed to ‘break Britain’s rental market’ in 100 days.
It is an arresting headline. The evidence is considerably more complicated.
Official data shows rents are still rising, although rental inflation has slowed materially from its recent peak. Buy-to-let lending remains active, average gross yields have risen and mortgage arrears are falling. At the same time, proprietary transaction data suggests landlords are still buying, including an unusually high share of homes already associated with the rental sector.
None of this means the Renters’ Rights Act has been benign. It means the first 100 days look less like the end of buy-to-let than a change in what it takes to operate successfully within it.
Executive Summary
The first 100 days of the Renters’ Rights Act do not provide evidence of a rental market in collapse. Official data shows that rents continue to rise, although the rate of rental inflation has been slowing, while buy-to-let lending remains active and mortgage arrears have continued to fall.
At the same time, the reforms have materially changed the operating environment for landlords. Possession is more prescribed, rent increases are more structured, and greater importance now falls on initial rent setting, tenant selection, compliance and exit planning.
Proprietary transaction data also suggests that landlords remain active buyers, including acquiring properties already within the rental sector. However, it is too early to conclude that this represents a structural consolidation of the market.
For investors, our view is that the reforms have not removed the investment case for buy-to-let. They have reduced the margin for poor acquisition, excessive leverage and weak management. The most important evidence on the Act’s longer-term impact, particularly possession times, Tribunal activity and rental supply is still to come.
What the official data says first
The most reliable starting point is theofficial rent data. In June 2026, the average UK private rent was £1,388 permonth, 3.3% higher than a year earlier. In England, the average reached £1,446,up 3.4%. The ONS says rent inflation has generally been slowing since December2024.
That national average also hides pronounced regional differences. The North East recorded annual rent inflation of 6.3%,while London recorded 2.2% - the lowest rate among English regions.

These figures do not point to an immediate nationwide acceleration in rents following the reforms. ONS data shows that private rents were still rising in June, but the annual rate of rental inflation had generally been slowing since December 2024. With the reforms having taken effect only on 1 May, however, it is far too early to isolate their impact from wider market conditions.
The first 100 days in numbers
The early picture is mixed. Official and primary-industry data shows rents continuing to rise, buy-to-let lending remaining active and mortgage arrears falling, while proprietary datasets provide early indications of how landlord behaviour is changing.

Buy to let investment and rental yield calculator

Sources and context:
Private rent figures are from the Office for National Statistics' Private rent and house prices, UK: July 2026 release. Buy-to-let lending, yields, interest rates and arrears are drawn from UK Finance's Q1 2026 buy-to-let lending data. Possession claims and court timelines come from the Ministry of Justice's January to March 2026 landlord possession statistics. The court figures pre-date the 1 May reforms and are included as a baseline against which subsequent post-reform data can be assessed.
Taken together, these indicators do not suggest a buy-to-let market under immediate financial stress. New lending remained active in Q1, average gross yields were above 7% and mortgage arrears continued to fall. The court data tells us something different: possession was already a lengthy process before the new regime began. With the reforms taking effect on 1 May, the more meaningful test will be how these indicators change over the quarters ahead.
Sources and context:
Unlike rents, mortgage lending and possession proceedings, there is no comprehensive official dataset that captures landlord buying and selling behaviour in real time. We therefore use original proprietary research where it measures activity that government statistics do not. Landlord purchase activity and previously rented acquisitions are drawn from Hamptons’ transaction analysis. The £49.7bn refinancing figure comes from Paragon’s analysis of fixed-rate buy-to-let mortgage maturities, while Build to Rent investment is based on Savills’ UK BTR market data. These measures use different methodologies and periods and should be considered as complementary market indicators rather than directly comparable statistics.
The proprietary data adds an important layer to the official picture. Landlords were still active buyers in early 2026, with 13.3% of Great Britain purchases attributed to landlords, while 23% of landlord acquisitions had previously been rented. At the same time, an estimated £49.7bn of fixed-rate buy-to-let debt is approaching maturity, creating a potentially significant refinancing test for existing owners. Institutional capital also remains active, with £2.2bn invested in UK Build to Rent during Q2. Together, these indicators suggest a market undergoing adjustment rather than a straightforward withdrawal of capital from rented housing.
First, what actually changed?
The significance of 1 May should not be understated. Existing assured shorthold tenancies in England became assured periodic tenancies and, under the Government’s Renters’ Rights Act reforms, landlords can no longer serve a new Section 21 notice.
A landlord who wants the property back must instead establish a statutory possession ground. Grounds for selling or moving in are subject to restrictions, including protection during the early part of a tenancy. That makes the exit strategy something investors increasingly need to think about before acquisition rather than after it.
Rent setting changed too. Under the new assured periodic tenancy rules, increases are generally restricted to once every 12 months through the statutory Section 13 process, with at least two months’ notice. Tenants can challenge a proposed rent at the First-tier Tribunal, which cannot determine a rent above the landlord’s proposed figure. Rental bidding is also prohibited, and restrictions apply to rent in advance.
None of those changes makes a rental investment unworkable. Collectively, however, they make pricing, tenant selection, documentation, compliance and possession planning more consequential.

So where is the landlord exodus?
There is no official government dataset capable of identifying precisely which homes are being bought and sold by landlords in real time. HMRC can identify additional-property tax treatment, but that also captures second homes and other purchasers. For this question, a specialist transaction dataset is more informative.
Hamptons’ analysis shows that in June 2026 landlords accounted for 10.2% of purchases, while homes listed for sale that had been advertised for rent during the previous five years represented 9.2% of listings. The latter was down from 11.3% a year earlier.
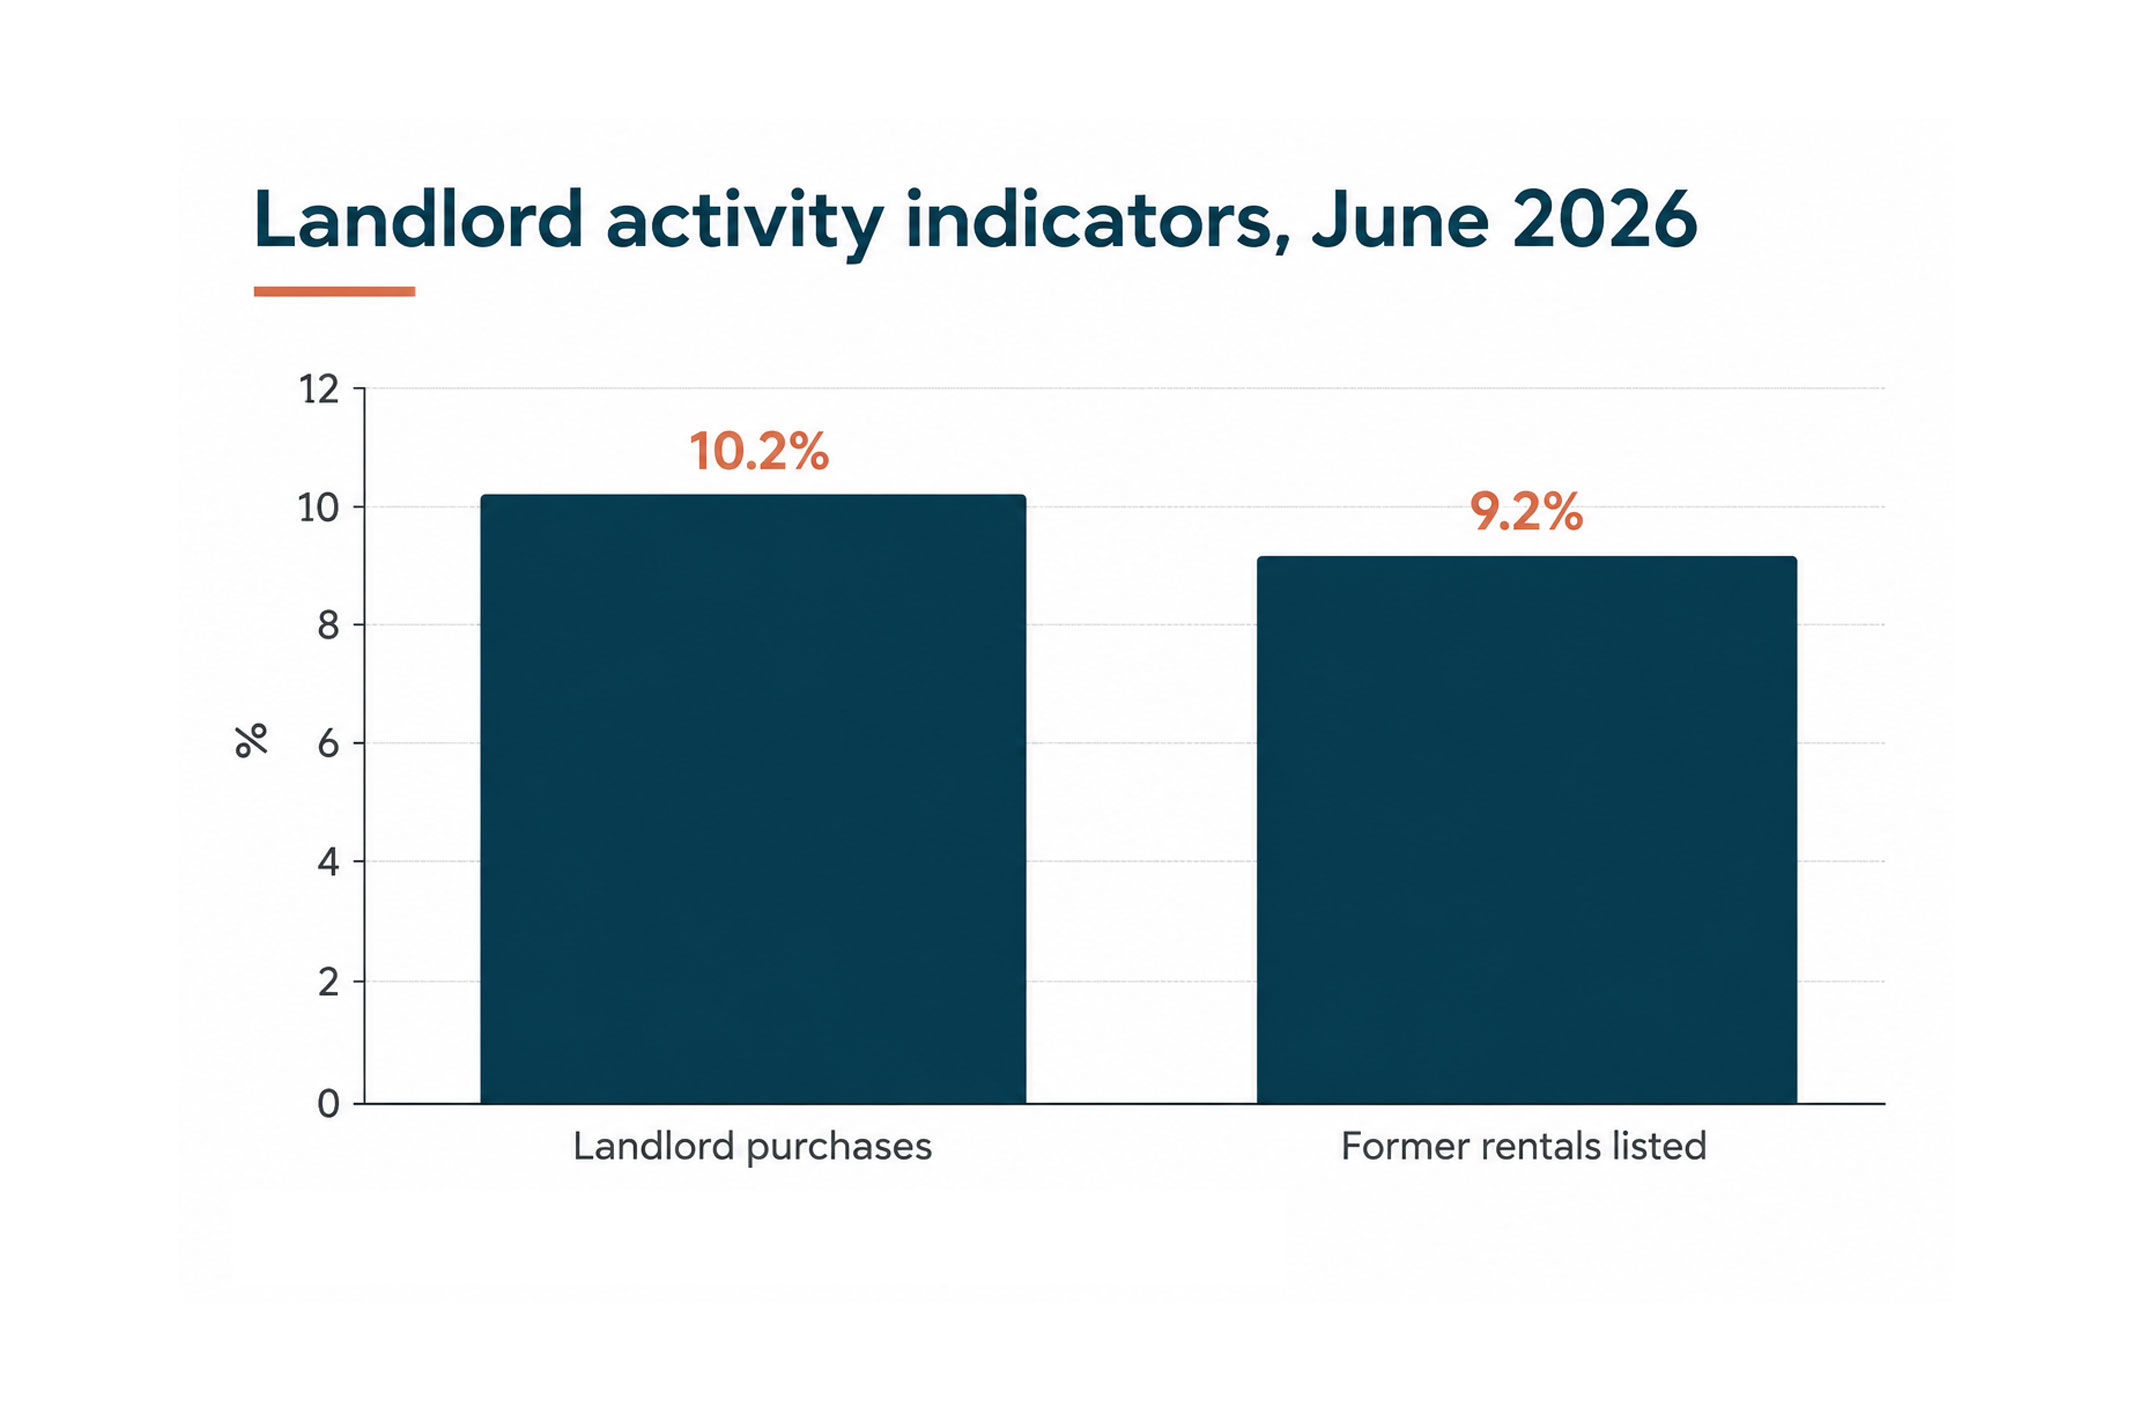
The comparison should be handled carefully - a home previously advertised for rent is not a definitive count of a landlord exit, and the two measures are not identical. What the figures do not show, however, is an obvious post-May surge in ex-rental stock being put up for sale.
That may partly reflect timing. The reforms were years in the making and arrived after a decade of tax and financing changes. Landlords who no longer liked the economics had ample opportunity to leave before May 2026.
A market can lose landlords without necessarily losing rental homes.
The useful question is not “Does buy-to-let work?” but “Does this property work at this price, rent and financing structure?”
The investment case has not disappeared. The margin for poor acquisition, excessive leverage and weak management has.
Perhaps the landlords are changing instead
The more interesting statistic may be what investors are buying. Between January and April 2026, landlords accounted for 13.3% of purchases across Great Britain, up from 9.9% a year earlier and the highest share since 2016. Hamptons also found that 23% of landlord acquisitions had previously been rented, compared with 16% in 2025.
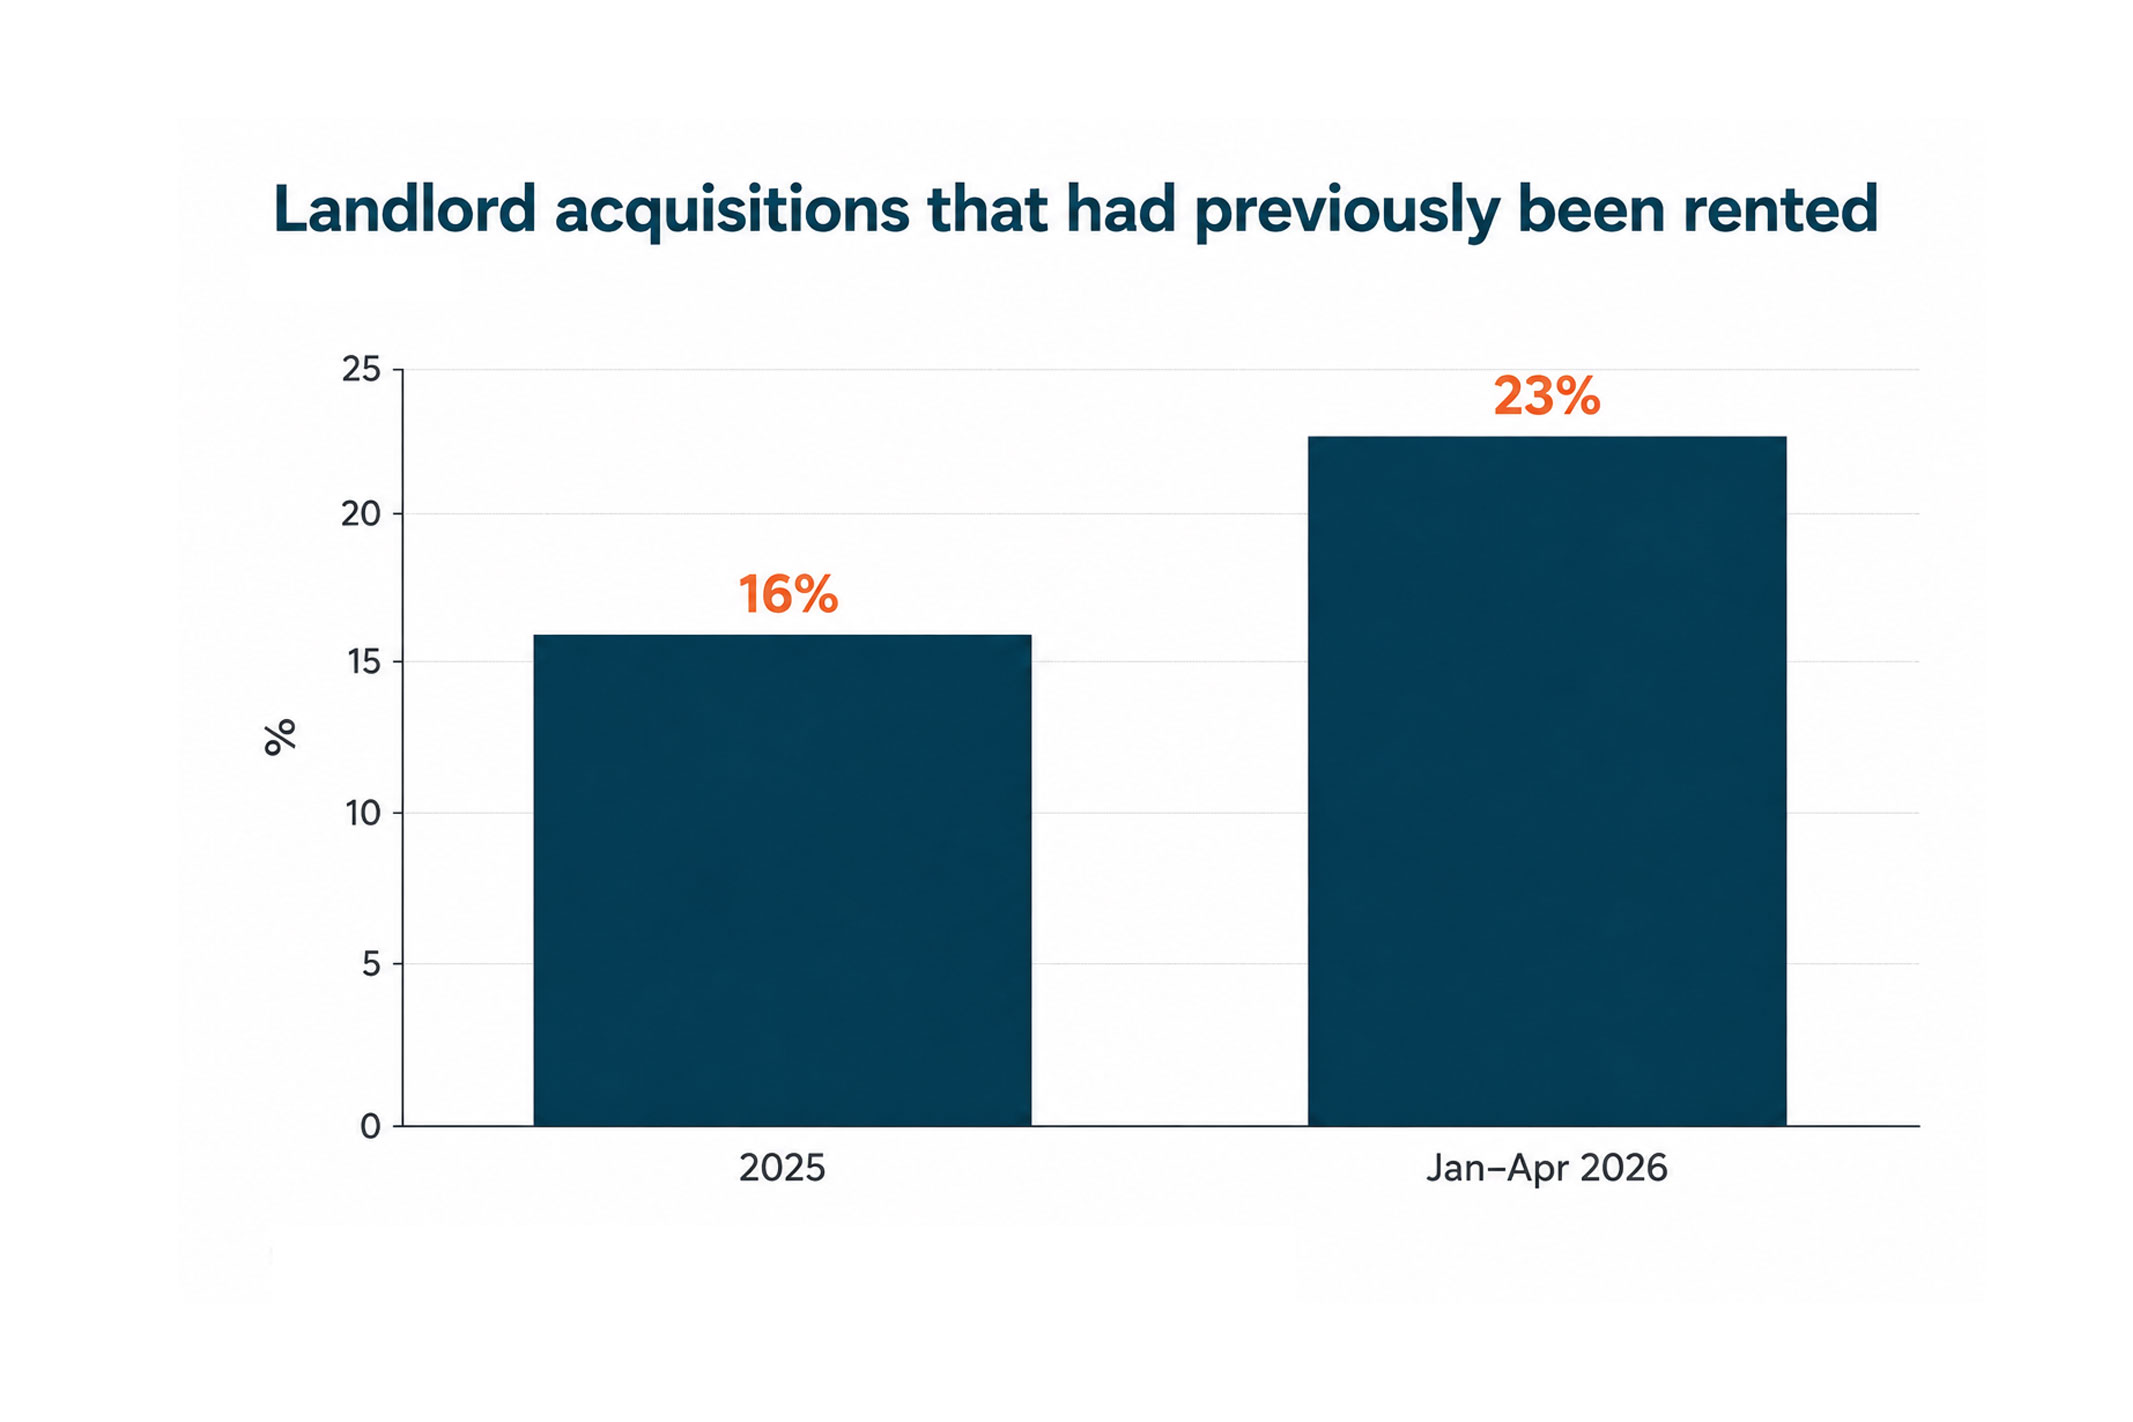
This does not prove that large professional landlords are buying wholesale from small amateur landlords. The dataset does not identify every buyer and seller profile. But it does show that an unusually high share of landlord acquisitions is coming from the existing rental sector.

A landlord selling is therefore not automatically the same thing as a rental home disappearing. If one investor sells to another, ownership changes while the property can remain in the private rented sector.
The long-term question is whether regulation and financing are gradually concentrating ownership among investors with stronger balance sheets and more professional operating systems. After 100 days, that remains a hypothesis rather than a settled fact.
The bigger pressure may be sitting on landlords’ balance sheets
There is another reason to be cautious about attributing landlord behaviour entirely to the Renters’ Rights Act: a large refinancing wave is approaching.
Paragon analysis, drawing on UK Finance industry data, estimates that £49.7bn of fixed-rate buy-to-let mortgages are due to mature in the 12 months to November 2026. Its survey of 837 landlords found that 39% expected to refinance during 2026, rising to 53% among those with four or more buy-to-let mortgages.

Those figures do not describe a BTL mortgage market in broad distress. Lending remains active, gross yields have increased from 6.93% a year earlier, and UK Finance recorded 8,960 BTL mortgages more than 2.5% in arrears at the end of Q1 2026, down 560 from the previous quarter.
But averages conceal the position of individual landlords. An investor refinancing an old, highly leveraged loan can face a very different cash-flow equation from an investor underwriting a purchase today using current prices, rents and financing costs.
For investors assessing the sector in 2026, leverage may prove every bit as important as legislation.
The court system may become the real test
One of the biggest unknowns is possession. Here, 100 days is simply too short to reach a verdict because the latest comprehensive Ministry of Justice quarterly data predates implementation.
The 26.4-week median existed before Section 21 was abolished. The practical test of the new regime is therefore not just whether landlords have statutory possession grounds, but whether those grounds can be exercised predictably and within commercially workable timescales when court action is required.
The same is true of rent challenges at the First-tier Tribunal. It is too early to know whether volumes will remain manageable or produce meaningful delay. Claims either way should be treated as forecasts, not evidence.
Rental supply remains tight - but causation is not established
Official housing surveys provide a robust picture of the size of the private rented sector, but they are too slow-moving to measure live rental availability. For current listing supply, portal data remains the more appropriate tool.
Rightmove reported that available rental homes in Q2 2026 were 1% below the same quarter of 2025, the first annual fall in its available stock measure since 2022.
That is worth watching, but it should not be attributed automatically to the Renters’ Rights Act. Rental availability reflects landlord activity, tenant turnover, affordability, housebuilding, first-time buyer demand and broader economic conditions.
For investors, the relevant conclusion is simply that the reforms have arrived in a market where rental supply remains constrained. That can support occupancy and demand for well-located homes, but it does not rescue a property bought at the wrong price or underwritten on an unrealistic rent.
Property investment remains intensely local
National averages are especially dangerous in property. An average UK gross BTL yield of 7.21% says relatively little about whether an individual investment is attractive. Entry price, rent, tenant demand, financing, maintenance and prospects for capital growth vary materially between places.
Hamptons estimates that landlords accounted for 25.3% of home purchases in the North West between January and April 2026, up from 12.4% in 2025. That is a proprietary measure, but there is no government dataset that isolates landlord purchase share at this speed and level of detail.
It would be too simplistic to conclude that investors should therefore ‘buy in the North’. Higher yields can compensate for higher risk rather than represent a free additional return. The point is that as taxation, borrowing and compliance costs rise, purchase price and income margin become less forgiving.

Portfolio projection tool
Institutional capital is sending a different signal
The Build to Rent market offers a useful, if not directly comparable, perspective. Savills recorded £2.2bn of UK BTR investment in Q2 2026, the strongest second quarter on record. Real Estate:UK’s Q2 delivery report, prepared by Savills, meanwhile shows annual BTR starts down 79% to 3,455 homes.
The two measures point in different directions because they describe different risks. Buying an established rental asset with income already in place is not the same investment as taking planning, construction, financing and letting risk on a new scheme.
Institutional capital has not lost interest in rental income. It has become more selective about the route through which it takes exposure. That is an investment principle private landlords increasingly have to apply too.
What the first 100 days actually tell investors
The Renters’ Rights Act has unquestionably raised the operating hurdle for residential property investment. Possession requires greater planning. Initial rent setting carries more weight. Tenant selection, documentation and compliance matter more. Investors also need to think carefully about how an occupied property could eventually be sold or repositioned.
But the economic evidence is less dramatic than the political argument around it. Official rent inflation is slowing rather than exploding. BTL lending remains active. Average gross yields have risen. Mortgage arrears are falling. Specialist transaction data does not show an obvious post-May surge in landlord selling, while a high share of landlord acquisitions is coming from the existing rental sector.
At the same time, nearly £50bn of fixed-rate BTL debt is approaching maturity, the court system entered the reforms with lengthy possession timelines and live rental availability remains constrained.
Those are not the characteristics of a simple story - and they cannot sensibly be attributed to one piece of legislation after only 100 days.
The most important Renters’ Rights Act data probably has not been published yet. Over the coming quarters, possession claims, court timeliness, Tribunal activity, rental stock, landlord transactions and refinancing behaviour will provide a much clearer picture of how the new regime is changing investment outcomes.
For now, the evidence supports a narrower conclusion: the reforms have made the quality of the investment, the strength of the balance sheet and the quality of management more important.
The investment case has not disappeared. The margin for poor acquisition, excessive leverage and weak management has.
Sources and methodology
Unity Market Intelligence prioritises the closest available primary source. Official and statutory data, including the Office for National Statistics, Ministry of Justice and GOV.UK, is used wherever it directly measures the question being analysed.
Where official statistics do not provide the required market data, we use primary industry sources, such as UK Finance for buy-to-let lending and Rightmove for real-time rental availability. Proprietary specialist datasets, including research from Hamptons, Paragon and Savills, are used selectively where no equivalent official measure is available.
Proprietary data is not presented as official statistics. Where Unity draws a conclusion from a third-party dataset, we distinguish the underlying evidence from Unity's interpretation.
-v1.avif)
Get investor insights and early access to opportunities
Join our investor briefings for structured insights, market updates, and priority access to new deals.

No spam, just timely insights for investors We respect your privacy and never sell your data
.png)
Rental market and buy-to-let fundamentals
Indicator
Latest figure
Source type
Landlord activity and investment indicators
Indicator
Latest figure
Source
Buy-to-let lending conditions, Q1 2026
UK BTL lending measure
Q1 2026
Landlord possession court baseline before the Renters’ Rights Act
Indicator
Q1 2026
Official source: Ministry of Justice - Mortgage and landlord possession statistics, Jan-Mar 2026
UK Build to Rent investment and development activity, 2026
BTR indicator
Latest figure
Specialist sources: Savills - Q2 2026 BTR investment, Real Estate: UK - Q2 2026 BTR report
Case study

- Property Price:£275k
- Mkt Value at purchase:£290k
- Day one equity:£14,500
- Yield:7.2%
- ROCE:28.6%
.avif)


