
.jpg)










For those acquiring a buy to let property, Kent contains markets ranging from average prices of approximately £271,000 in Dover to £554,000 in Sevenoaks. Correspondingly, indicative gross yields vary materially across the county, reflecting the contrasting economics of affluent commuter belts, lower-entry-price coastal towns, and changing urban corridors.
Therefore, when considering Kent property investment, asking whether the whole county is a good place to invest is too broad a question. A more practical approach involves examining which specific local authorities align with an investor’s strategy, assessing trade-offs between capital entry points, tenant demographics, historical price performance, and achievable rental income.
For property investors comparing the best buy-to-let areas in the UK, this guide analyses the evidence to identify how different Kent markets perform on key investment metrics.
Executive Summary
The following key findings summarise the fundamental investment economics across the county:
- Kent contains materially different property markets, rather than operating as a single homogeneous landscape.
- Dover has the lowest average purchase price among the markets compared (£271,000), while Sevenoaks has the highest (£554,000).
- Dartford produces the highest indicative overall gross yield in the dataset at approximately 5.58%.
- Medway also exceeds 5% on the indicative overall yield calculation.
- Several locations including Swale, Ashford, Maidstone, and Gravesham produce indicative terraced-house yields above 5%
- Folkestone & Hythe recorded the strongest five-year house-price growth (+15.7%) among the locations compared.
- Dartford’s five-year average price movement was essentially flat, despite its comparatively high current indicative yield.
- Recent rental growth has been particularly strong in the coastal markets of Folkestone & Hythe (10.8%) and Dover (9.7%).
- Recent UKHPI data shows weaker price performance among flats compared to freehold houses in several Kent districts.
Is Kent a Good Place to Invest in Property?
Kent can offer a very different investment proposition to London property investment, but the case varies considerably by location. For those exploring buy-to-let Kent opportunities, purchase prices range from £271,000 in Dover to £554,000 in Sevenoaks, while indicative gross yields range from 3.89% to 5.58% across the markets analysed.
Average property prices in the broader South East region rose by just 1.2% in the year to May 2026. Despite relatively subdued regional growth, several Kent districts recorded positive annual house-price growth. For investors, the trade-off is often between purchase price, connectivity, rental income and yield, particularly in a lending environment where average fixed mortgage rates sit around 4.92%.
Furthermore, county-level statistics obscure critical local variations. An average price of £346,000 across the Kent local authority area (which excludes the Medway unitary authority for statistical purposes) fails to represent the accessible terraced housing stock available in Swale or Medway, nor does it reflect the large detached properties dominating the commuter belt. Asset and location selection within Kent are critical to the investment's underlying economics.
Kent Property Market at a Glance
The following table compares current prices, rents, indicative yields, and historical growth across 8 selected Kent local authorities.
Methodology Note:
- Property prices use May 2026 UK House Price Index (UKHPI) data.
- Rental prices use June 2026 Office for National Statistics (ONS) private rent data.
- Indicative gross yield is calculated as (annualised average rent ÷ average property price).
- These are area-level comparison metrics, not achieved or guaranteed investor returns. Actual returns depend on acquisition price, property condition, rent, financing, management costs, maintenance, voids, tax, and other factors.
House Prices in Kent
When evaluating property for sale in Kent, analysing house prices requires dismantling the county average to understand localised entry points. Sevenoaks stands as the most expensive local authority in the dataset at £554,000, while Dover represents the most accessible market at £271,000.
Rental Prices and Buy-to-Let Yields in Kent
The Kent rental market exhibits significant divergence. While the South East average rental growth registered at 2.3% annually in June 2026, rental inflation in East Kent outpaced regional norms. Folkestone and Hythe recorded a 10.8% annual increase, and Dover achieved 9.7% growth, suggesting potential localized supply-demand imbalances on the coast.
However, the highest absolute rents are still captured in the affluent western and northern commuter belts, with Sevenoaks generating £1,798 monthly and Dartford achieving £1,566. When mapped against capital acquisition costs, the data indicates that the highest rental income in Sevenoaks corresponds with the weakest overall indicative yield, primarily due to higher capital entry costs.
Where Are the Best Places to Invest in Property in Kent?
For investors looking for Kent properties to buy, the market comprises distinct economic zones, each offering a different combination of entry price, rental income, indicative yield and historical price performance.
Medway
Medway is frequently reviewed by yield-focused investors. It offers an accessible average price of £293,000 and an indicative overall yield of 5.05%. The area benefits from high-speed rail links to St Pancras. Investors may observe differences between property types here: flat prices contracted by 3.8% over the last year, whereas terraced properties show stronger underlying economics.
Dartford
Dartford acts as a direct overspill market for outer London. It carries an average price of £337,000 and generates the highest indicative overall yield in the comparison at 5.58%. However, capital values have contracted marginally (-0.8%) over the past year, and its five-year price growth was flat, illustrating the trade-off between current income generation and historical house-price growth.
Maidstone
Maidstone's district-wide indicative yield of 4.40% looks relatively modest. However, the picture changes when property type is considered: average terraced prices of approximately £294,000 and average terraced rents of £1,296 produce an indicative gross yield of around 5.29%. Its average property price has also increased 13.1% over the five years to May 2026.
Gravesham and Swale
When seeking investment property for sale, Kent commuter towns like Gravesham bridge the gap between Dartford's yields and Medway's entry points. It combines annual rental growth of 6.3% with high-speed access to St Pancras. Swale, encompassing Sittingbourne, offers a lower average entry price of £294,000 and 3.7% annual house-price growth, providing a value option for investors priced out of locations closer to London.
Ashford and Canterbury
Ashford operates as a major transport nexus, though recent capital growth has been modest at 0.7%, yielding an indicative average of 4.34%. Canterbury, conversely, is heavily associated with its status as an educational and cultural hub. The area features a diverse economic base supported by universities and tourism. Its average property price rose by 5.1% over the year to May 2026, standing out against the regional average.
Folkestone & Hythe and Dover
Folkestone & Hythe combines a relatively low average purchase price of £311,000 with the strongest five-year price growth in the comparison (+15.7%) and unusually high recent rental growth of 10.8%. Dover represents the most affordable market at £271,000, accompanied by a 9.7% rise in rents. While both offer lower entry points and strong recent rental growth, coastal economies can be fragile, and investors should not assume double-digit rental inflation will persist indefinitely.
West Kent Commuter Belt
Locations such as Sevenoaks (£554,000), Tunbridge Wells (£452,000), and Tonbridge & Malling (£403,000) operate on different economics. High capital costs compress indicative gross yields below 4.5% in these areas. These markets may be more relevant to investors willing to accept lower initial yields in exchange for exposure to higher-value West Kent locations.
The investment case depends not simply on buying within the county boundaries, but on selecting the right local market, the right property type, and the right acquisition price for the investor’s specific objectives.
Better connectivity can command higher rents, but investors may also pay substantially more for the underlying property.
Which Kent Areas Offer the Highest Indicative Rental Yields?
Yield generation is primarily concentrated in North Kent, where Dartford (5.58%) and Medway (5.05%) are the main districts breaking the 5% barrier on average across all stock types.
However, indicative yields can differ materially by property type; traditional terraced housing frequently outperforms the blended district averages.
What Type of Property Should Investors Consider in Kent?
Recent UKHPI data shows weaker annual price performance among flats in several Kent markets, including Medway (-3.8%), Dartford (-3.4%), Gravesham (-3.0%) and Tunbridge Wells (-2.8%). This does not mean flats are inherently poor investments. However, investors should assess lease length, service charges, major works liabilities and building-specific issues alongside headline gross yield.
For traditional single-let investors reviewing houses to buy in Kent, the table below compares the current economics of terraced properties across 8 selected markets.
For investors reviewing their investment criteria, traditional terraced houses, particularly freehold properties may warrant attention from single-let investors. When assessing a specific house for sale, Kent freehold properties typically avoid the recurring service charges associated with many leasehold flats. These houses frequently deliver indicative gross yields exceeding 5% across much of the county.
What Does the Five-Year House Price Data Tell Us?
When examining historical house-price performance, historical market performance provides a broader context than short-term fluctuations, though historical growth does not guarantee future returns.
This data highlights a critical distinction between current yield and historical price performance. Dartford currently produces the highest indicative overall yield in the comparison at approximately 5.58%, but its average house price is approximately unchanged over the five years to May 2026.
Conversely, Medway offers a strong indicative overall yield of 5.05% alongside 12.6% five-year price growth. Gravesham and Maidstone show solid terraced-house economics alongside strong five-year historical price performance (+14.7% and +13.1% respectively). This illustrates why investors should not select locations on headline yield alone; both rental income and changes in capital value contribute to an investor's overall return.
Where Are the Cheapest Places to Buy Property in Kent?
For investors specifically looking for houses for sale in Kent UK, the pursuit of lower entry prices leads toward the north and east coasts. The three most affordable local authorities are Dover (£271,000), Medway (£293,000), and Swale (£294,000).
However, cheap houses for sale in Kent UK do not automatically equate to a good investment. The fundamentals of these areas differ: Medway combines a comparatively low average purchase price of £293,000 with an indicative overall gross yield of 5.05%, whereas Dover has seen high recent rental inflation. Swale balances the two, offering stronger capital growth among the cheaper districts but more subdued recent rental income growth.
Kent and the London Commuter Market
When reviewing homes for sale, Kent's appeal to commuters is closely tied to its rail network. The presence of high-speed services and traditional commuter lines correlates with distinct property markets clustered around transit hubs.
However, investors must carefully navigate the "commuter premium". Better connectivity can command higher rents, but investors may also pay substantially more for the underlying property. For instance, Sevenoaks generates a high average rent of £1,798, but with an average property price of £554,000, the indicative overall yield compresses to 3.89%. Investors comparing commuter markets may also wish to review alternatives such as buy-to-let investments in Essex to assess relative value across the South East.
How Much Money Do You Need to Invest in Kent Property?
For international or regional buyers seeking property for sale in Kent, we can model an indicative purchase of a traditional terraced house in a balanced market like Medway, utilising standard assumptions that might be entered into a buy-to-let calculator.
Example Investment Economics: £270,000 Terraced House (Medway)
- Purchase Price: £270,000
- Deposit (25%): £67,500
- Stamp Duty Land Tax (incl. 5% surcharge): £17,000
- Approximate Legal & Survey Costs: £2,000
- Total Indicative Capital Required: £86,500
- Mortgage Amount (75% LTV): £202,500
- Average Monthly Rent: £1,251
- Indicative Gross Yield: 5.56%
- Estimated Mortgage Cost (4.92% Interest Only): ~£830 per month
- Illustrative Pre-Cost Cash Flow: ~£421 per month
Note: The illustrative pre-cost cash flow of £421 is calculated before management fees, maintenance, insurance, compliance, void periods, tax, refurbishment, and other ownership costs. It should not be interpreted as net profit.

Portfolio projection tool

Risks of Buy-to-Let Investment in Kent
Investors should navigate several local risks to protect their capital:
- Paying too much for connectivity: A higher rent does not necessarily compensate for a substantially higher purchase price.
- Ignoring leasehold costs: Service charges, ground rent where applicable, major works and lease terms can materially change net returns.
- Extrapolating recent growth: Folkestone & Hythe's +10.8% and Dover's +9.7% annual rent growth are historical observations, not reasonable default assumptions for an investment appraisal.
Is Kent Right for Your Property Investment Strategy?
The evidence allows us to categorize Kent into three broad investor profiles:
- Income-focused: Dartford and Medway currently lead the overall indicative yield comparison.
- Balanced: Maidstone, Gravesham and potentially Medway are interesting because property-type yields and five-year historical price performance show a different balance of income and capital movement.
- Higher-capital/lower-yield: Sevenoaks, Tunbridge Wells and Tonbridge & Malling require substantially greater acquisition capital while producing lower indicative gross yields.
Conclusion
The data does not identify one universally “best” Kent investment market. Dartford currently leads on indicative overall yield, while Medway, Gravesham and Maidstone show a different balance between income and historical price performance. Folkestone & Hythe has recorded the strongest five year price growth in the comparison, but recent trends should not be assumed to continue.
For those looking to invest in property, Kent is too broad a category. The investment case depends on the specific town, property type, purchase price and achievable rent.
How Unity Approaches Location Selection
Area level data is only the starting point. Individual properties still need to be assessed on acquisition price, achievable rent, condition, local demand and the potential costs of ownership. You can read more about how we source investment properties and our investment criteria we use when assessing opportunities.
Terraced House Comparison
Location
Average Terraced Price
Average Terraced Rent
Indicative Gross Yield
.png)
-v1.avif)
Get investor insights and early access to opportunities
Join our investor briefings for structured insights, market updates, and priority access to new deals.

No spam, just timely insights for investors We respect your privacy and never sell your data
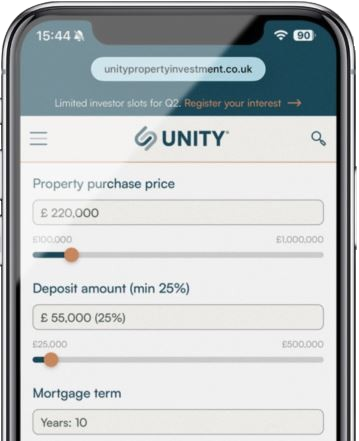
Buy to let investment and rental yield calculator
Kent Investment Area Comparison
Location
Average Property Price
Average Monthly Rent
Indicative Gross Yield
1-Year Price Growth
5-Year Price Growth
Five-Year House Price Performance
Location
May 2021 Average
May 2026 Average
5-Year Change
Frequently Asked Questions
Is Kent a good place to invest in property?
Where are the cheapest places to buy investment property in Kent?
Which areas in Kent offer the highest rental yields?
Is it better to invest in flats or houses in Kent?
Does proximity to a London commuter station guarantee a good investment?
Case study
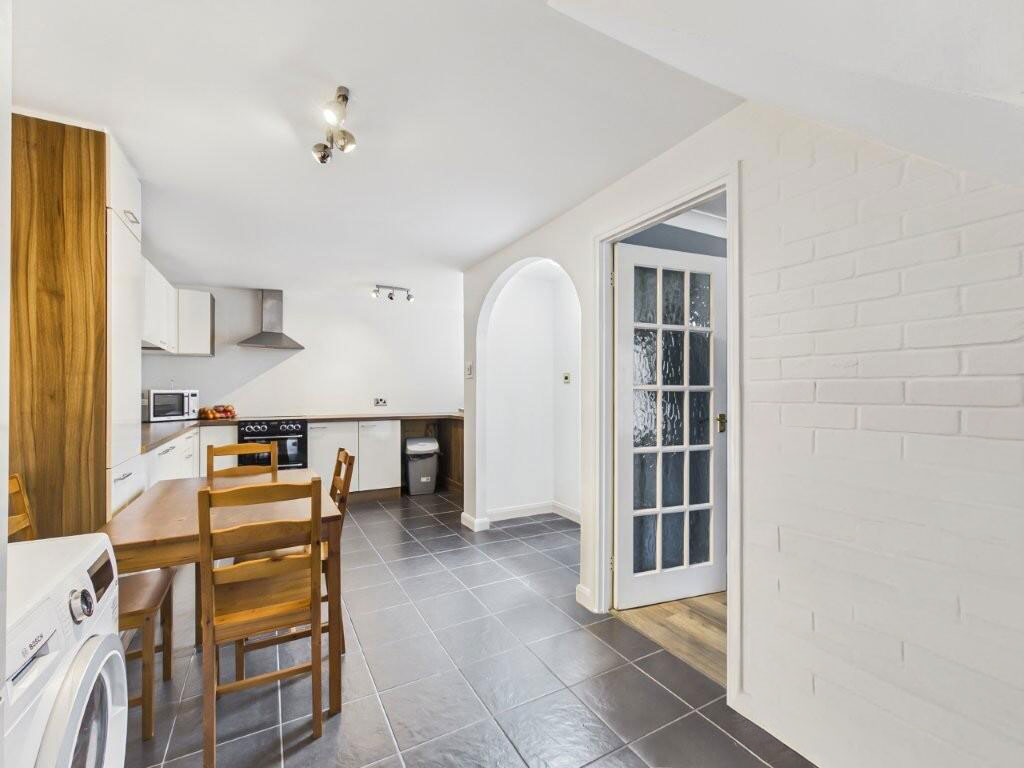
- Property Price:£275k
- Mkt Value at purchase:£290k
- Day one equity:£14,500
- Yield:7.2%
- ROCE:28.6%
.avif)